Dickcissel Night Flights | Home | Spring 2000 | Spring 2001 | Spring 2002 | Spring 2003 | Spring 2004 | Spring 2005
Comparison between spring 2000 and 2001 data
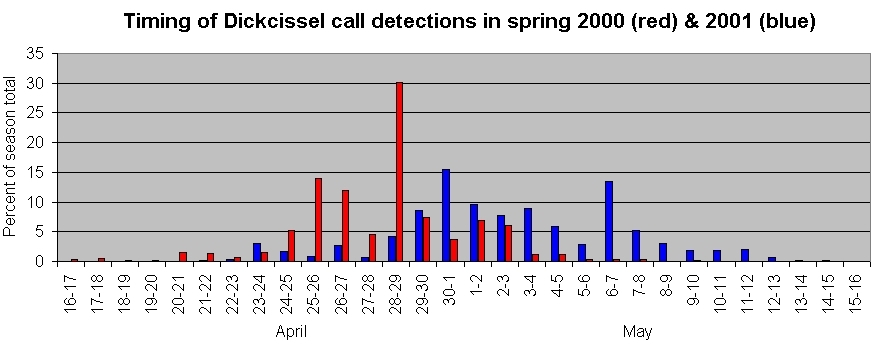
A. Timing
Fig. 1. This graph illustrates the percent of the 2000 & 2001 season total Dickcissel detections that were logged each day by the recording transect. The information gives a good indication of the timing of the Dickcissel flight across south Texas each season and illustrates interesting differences between the two years. The spring 2001 flight appears to be roughly a week later and significantly more protracted than the spring 2000 flight. Note that this data has been corrected slightly by estimating the quantity of calling on nights that were missed at specific stations. See the correction page for details.
B. Quantity
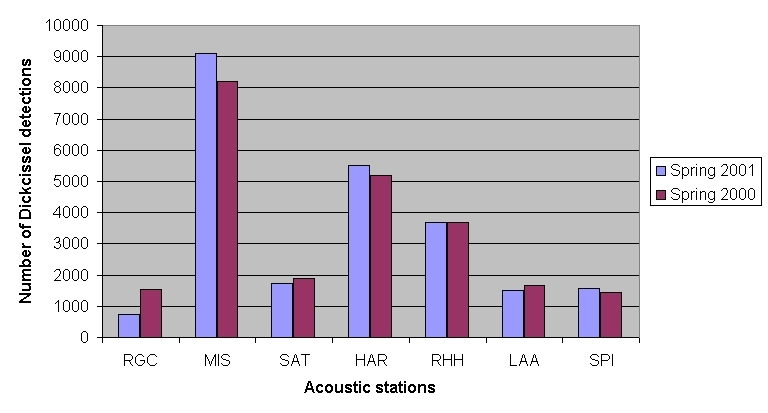
Fig.2. This graph shows the season total Dickcissel detections for spring 2000 and 2001 at seven stations in the acoustic monitoring transect that were operated in both years (see map for station locations). Two other stations were not comparable between years due to equipment problems. The graph above includes the estimated numbers for the few nights when no data was gathered. See the spreadsheets on the correction page to see these estimates. The seven stations above recorded 23,614 Dickcissel detections in spring 2000 and 23,826 in spring 2001 - remarkably similar. The large seasonal quantitative differences across the transect are hypothesized to be caused by differences in the quantity of artificial lighting at each location and their surrounding areas.